How to Use MoatScope
A complete guide to screening stocks through the lens of competitive advantage. Learn how to read the Quality × Valuation grid, understand moat ratings, and find high-quality businesses at reasonable prices.
🔭 What is MoatScope?
MoatScope is a stock research platform built around one core idea: the best investments combine high business quality with reasonable valuation. We map every stock on a Quality × Valuation grid so you can instantly spot great businesses that the market may be underpricing.
MoatScope tracks nearly 10,000 US-listed stocks. Of those, roughly 3,000 carry a full analysis — a moat rating, a seven-pillar quality score, and three-tier fair value estimates — and those are the ones plotted on the grid. The rest are searchable, with analysis rolling out continuously.
Unlike traditional stock screeners that flood you with raw data, MoatScope focuses on the interpretive layer — moat analysis, a seven-pillar quality scoring system, management evaluations, and fair value estimates — to help you understand why a company is (or isn't) a high-quality business.
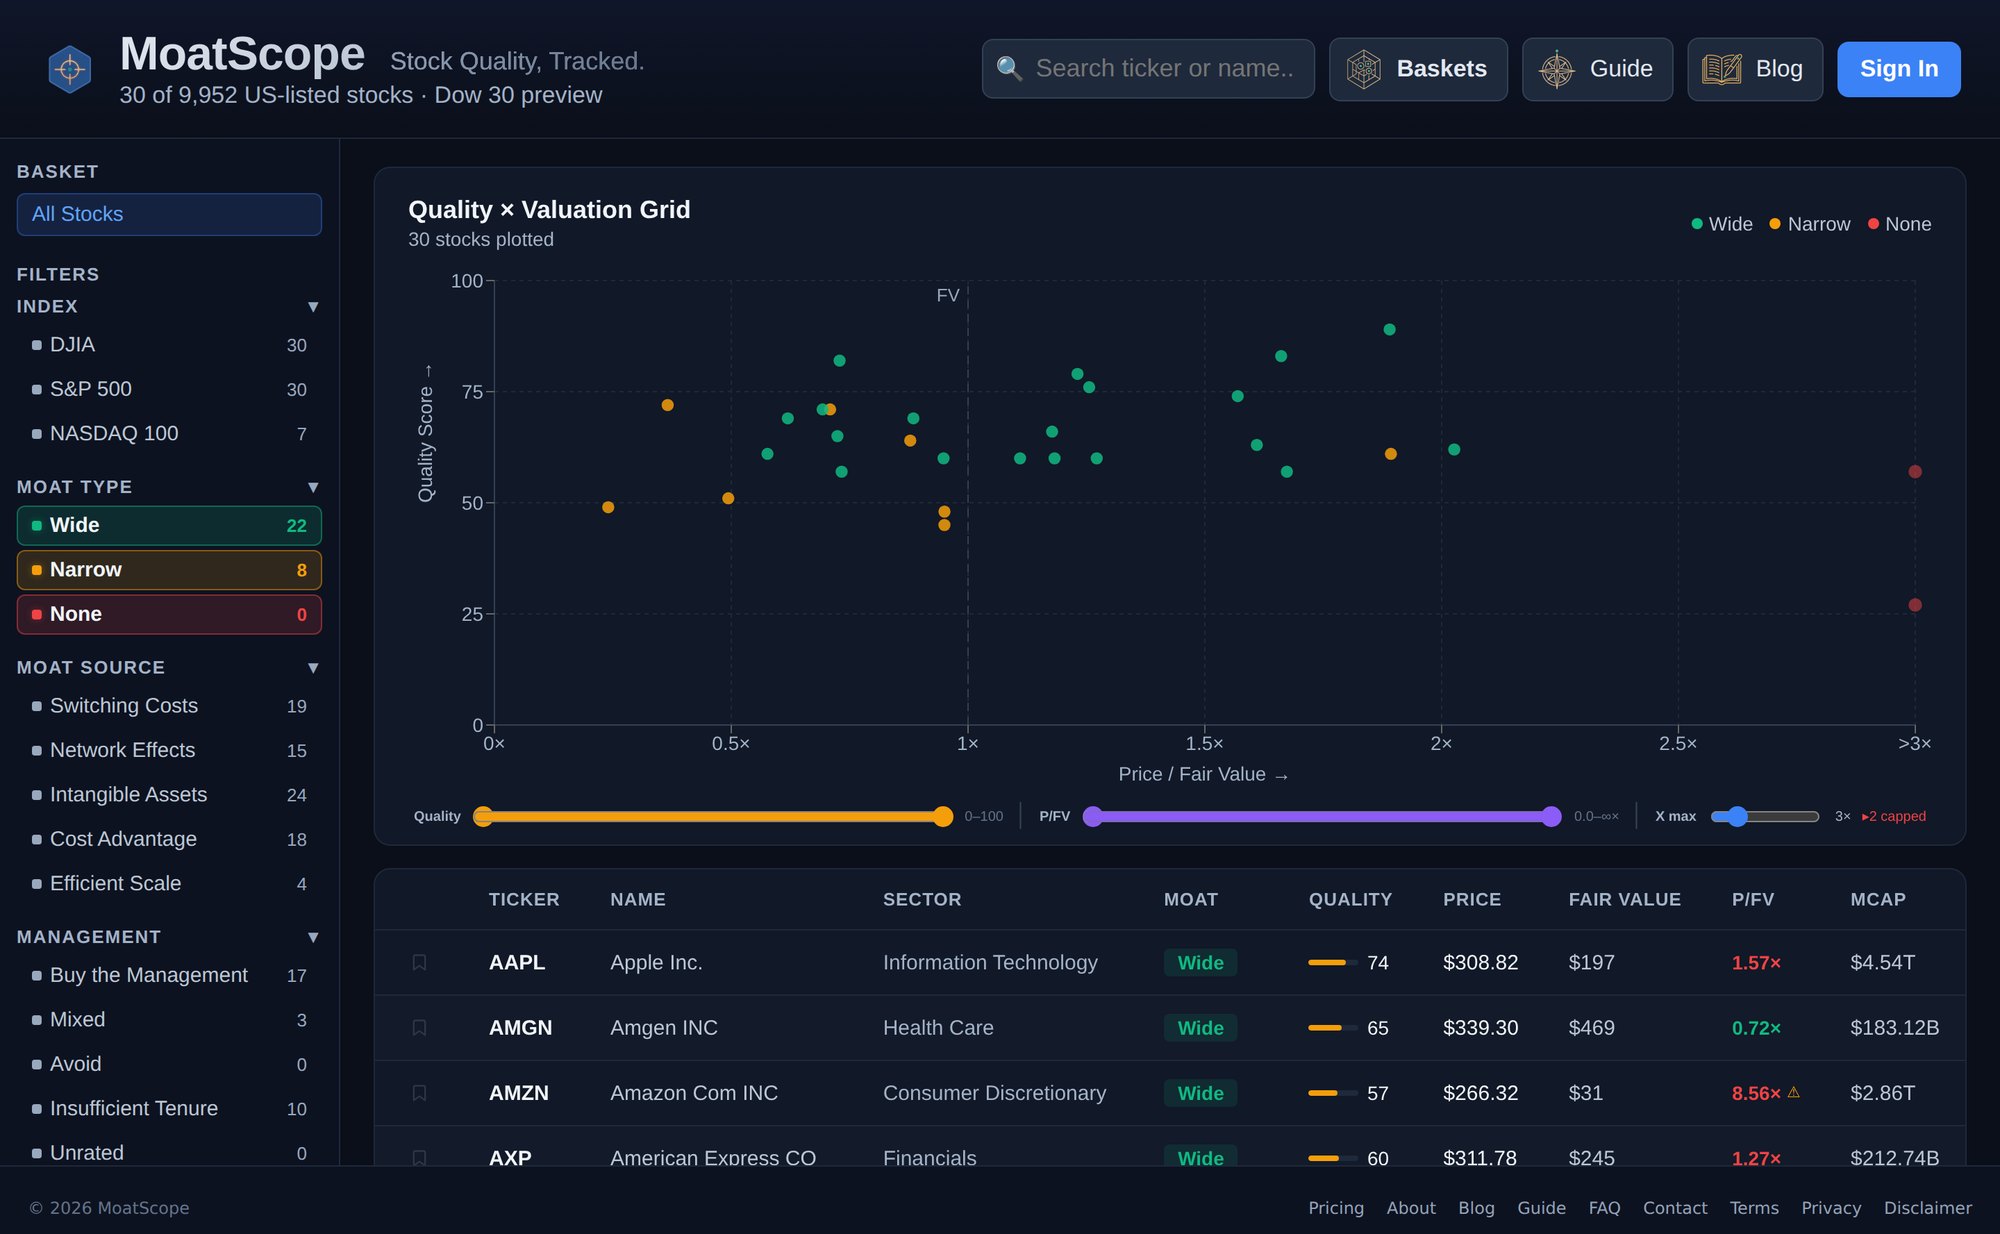
📊 The Quality × Valuation Scatter Plot
The scatter plot is the heart of MoatScope. Each dot represents a stock, positioned by two dimensions:
Y-axis — Quality Score (0–100): Higher means stronger fundamentals — better margins, higher returns on capital, more consistent cash generation, and a wider moat.
X-axis — Price / Fair Value (P/FV): Shows how the market price compares to MoatScope's fair value estimate. A P/FV of 1.0× means the stock trades at exactly fair value. Below 1.0× suggests undervaluation; above 1.0× suggests a premium.
Dots are color-coded by moat rating:
The vertical dashed line labeled FV marks the 1.0× fair value boundary. Stocks to the left of this line trade below their estimated fair value; stocks to the right trade at a premium.
Range sliders below the chart let you filter the visible range for both Quality Score and P/FV ratio. You can also adjust the X-axis maximum to zoom into stocks trading near fair value.
🏰 Moat Ratings
An economic moat is a durable competitive advantage that protects a company's profits from competitors — like a castle moat protects against invaders. MoatScope classifies every analyzed stock into one of three ratings:
The company has strong, durable competitive advantages that are likely to persist for 20+ years. Think Visa's payment network, Microsoft's enterprise ecosystem, or Apple's hardware-software lock-in.
The company has meaningful competitive advantages, but they're less durable or narrower in scope. Could persist 10–20 years. Examples include regional banks with strong deposit franchises or specialized manufacturers.
The company lacks a sustainable competitive advantage. Operates in a commoditized market, faces intense competition, or has no structural barriers protecting profitability.
Moat sources identify where the advantage comes from. MoatScope tracks five moat sources from the Morningstar framework:
Switching Costs — Customers face high costs (time, money, disruption) to switch away.
Network Effects — The product becomes more valuable as more people use it.
Intangible Assets — Brands, patents, licenses, or regulatory approvals that competitors can't easily replicate.
Cost Advantage — Structural ability to produce at lower cost than competitors.
Efficient Scale — Serves a market of limited size, discouraging new entrants.
⭐ Quality Score (0–100)
The Quality Score measures fundamental business quality on a scale from 0 to 100. It combines seven weighted pillars of financial analysis:
How to interpret the score:
💰 Fair Value Estimates
MoatScope calculates three fair value estimates for each stock, representing conservative, base, and optimistic scenarios:
The formula uses owner earnings (net income + depreciation & amortization − capital expenditures), adjusted for cash and debt on the balance sheet:
where Cash Flow = Net Income + D&A − CapEx
The P/FV ratio shown in the table and on the X-axis divides the current market price by the Base fair value estimate. A P/FV below 1.0× indicates the stock trades below estimated fair value; above 1.0× indicates a premium.
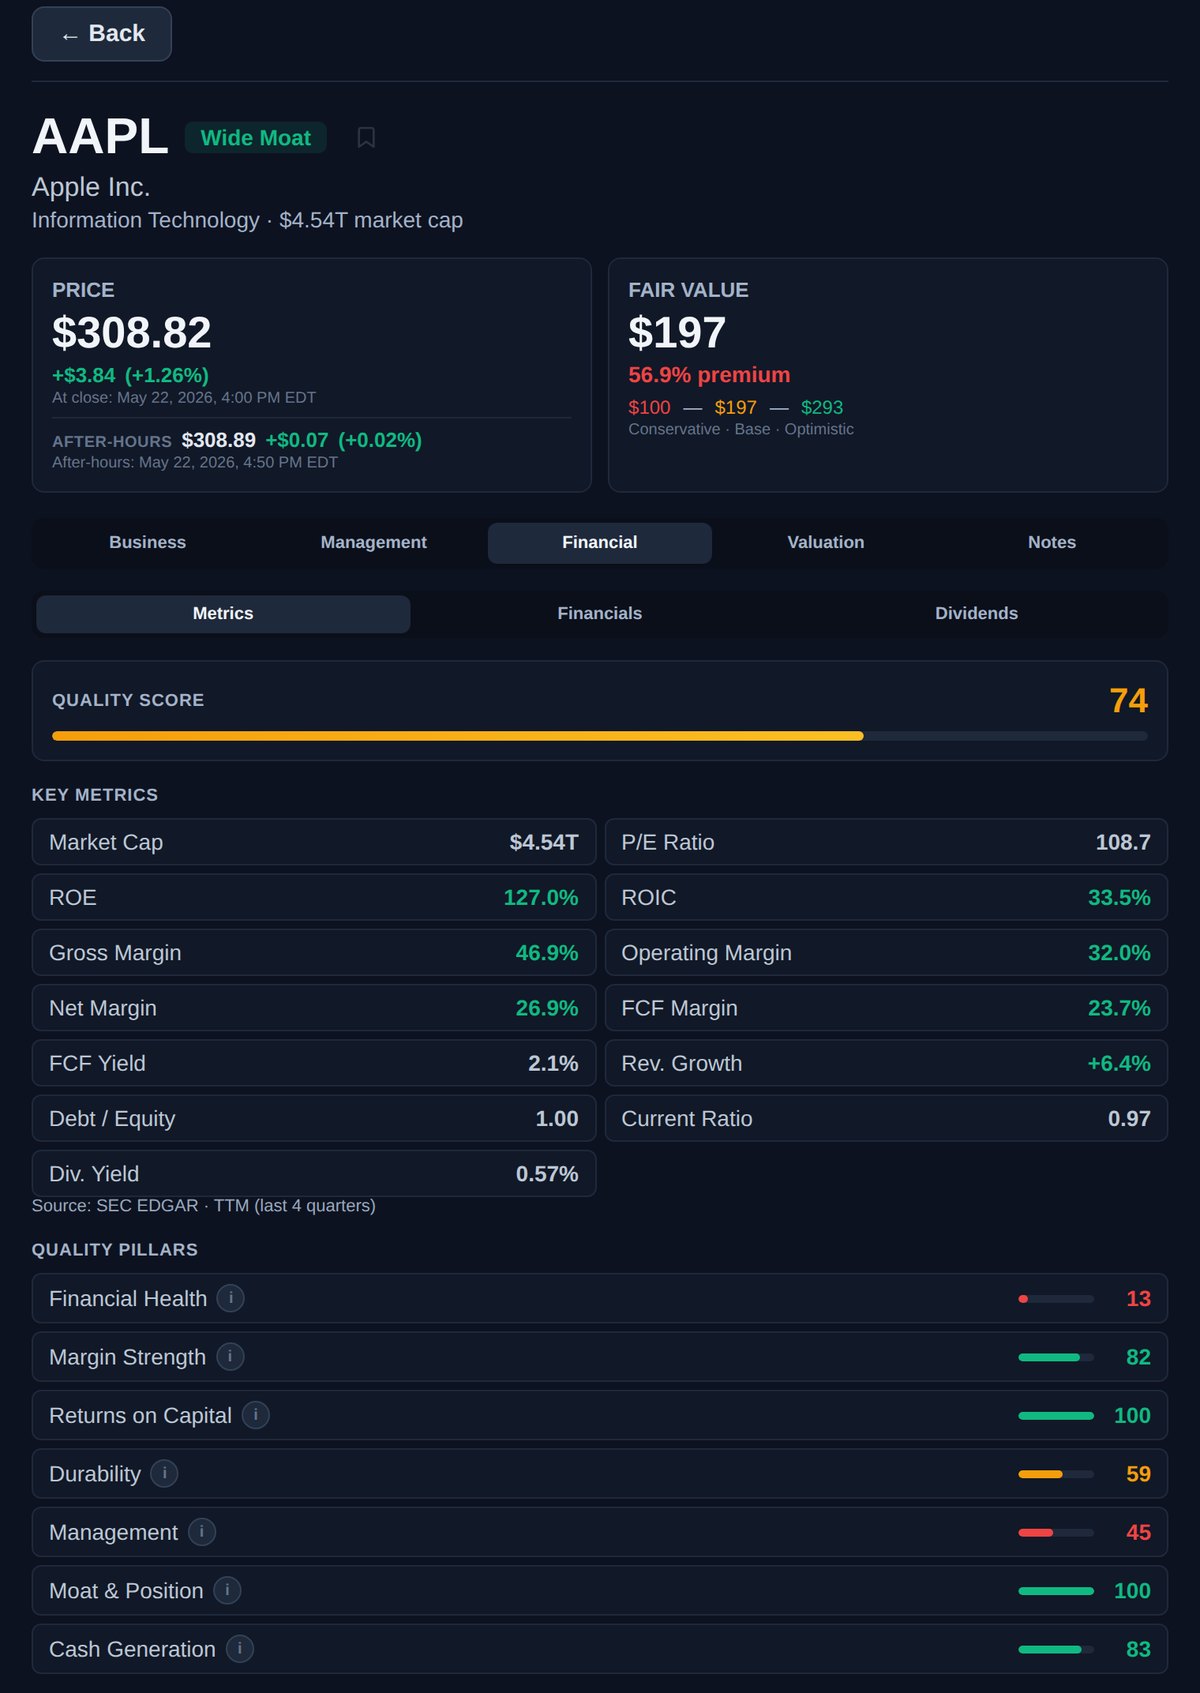
🔍 Stock Detail Panel
Click any stock in the table — or any dot on the grid — to open its detail panel. At the top you'll always see the essentials: ticker, company name, moat badge, sector, and market cap, alongside two cards.
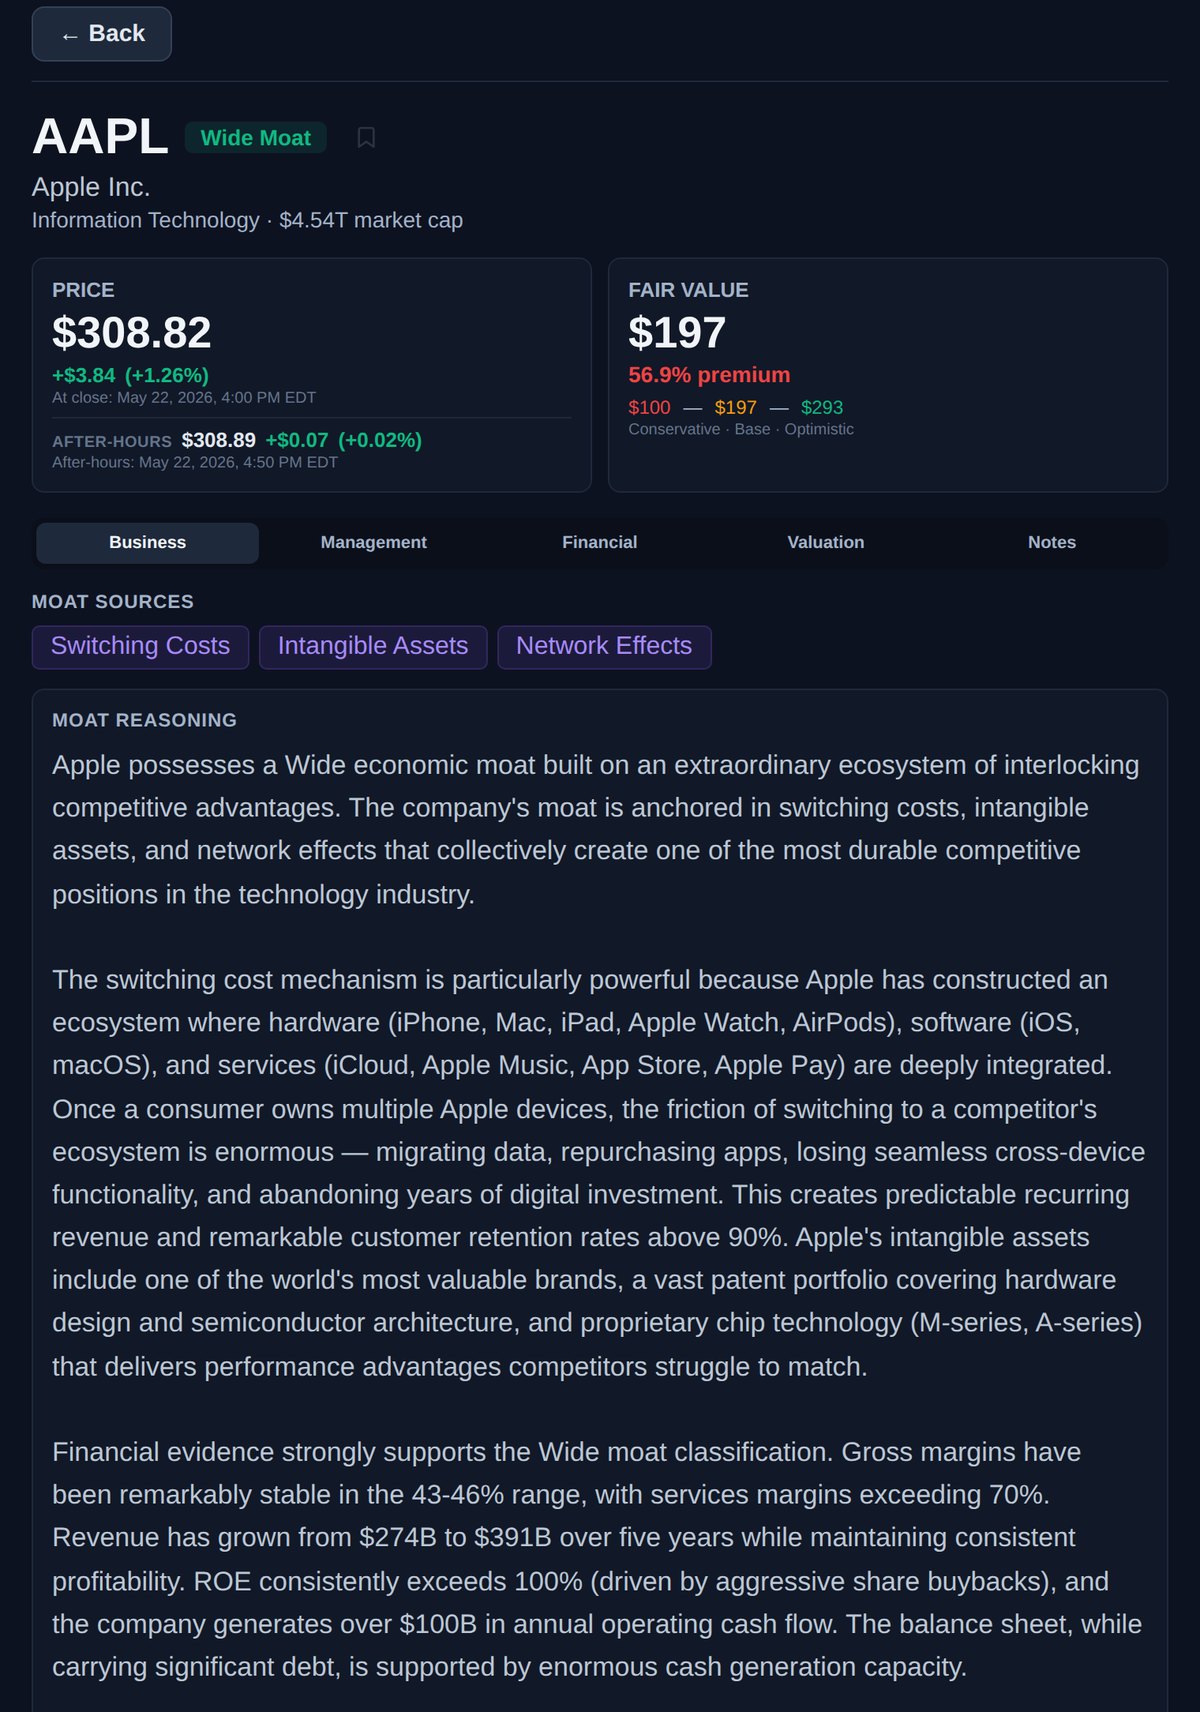
Price card: The latest price with the daily change. When a stock has traded after the close, an after-hours line appears below it with the extended-hours price and timestamp.
Fair Value card: The Base fair value estimate, the premium or discount to today's price, and the full Conservative → Base → Optimistic range beneath it.
Show Calculation: Expand this link under the cards to see the owner-earnings inputs behind the fair value for the most recent fiscal year.
Below the cards, five tabs organize everything MoatScope knows about the business:
Business — Moat sources, the full written moat reasoning, and the company profile (sector, industry, country, exchange, IPO date, market cap, website).
Management — A letter-grade evaluation of the CEO's stewardship, broken into six subscores with a plain-language verdict. Covered in detail below.
Financial — Three sub-views: Metrics (quality score, key ratios, and the seven pillars), Financials (full statements), and Dividends (per-year history and growth streak).
Valuation — A price-history chart with the fair value overlaid. Covered below.
Notes — Your private research notes on the stock, saved to your account.
👔 Management Grade
Great businesses can still be run poorly. The Management tab grades how well a company's leadership has served shareholders — expressed as a letter grade from A to F with a 0–100 score, the CEO's name, age, and tenure.
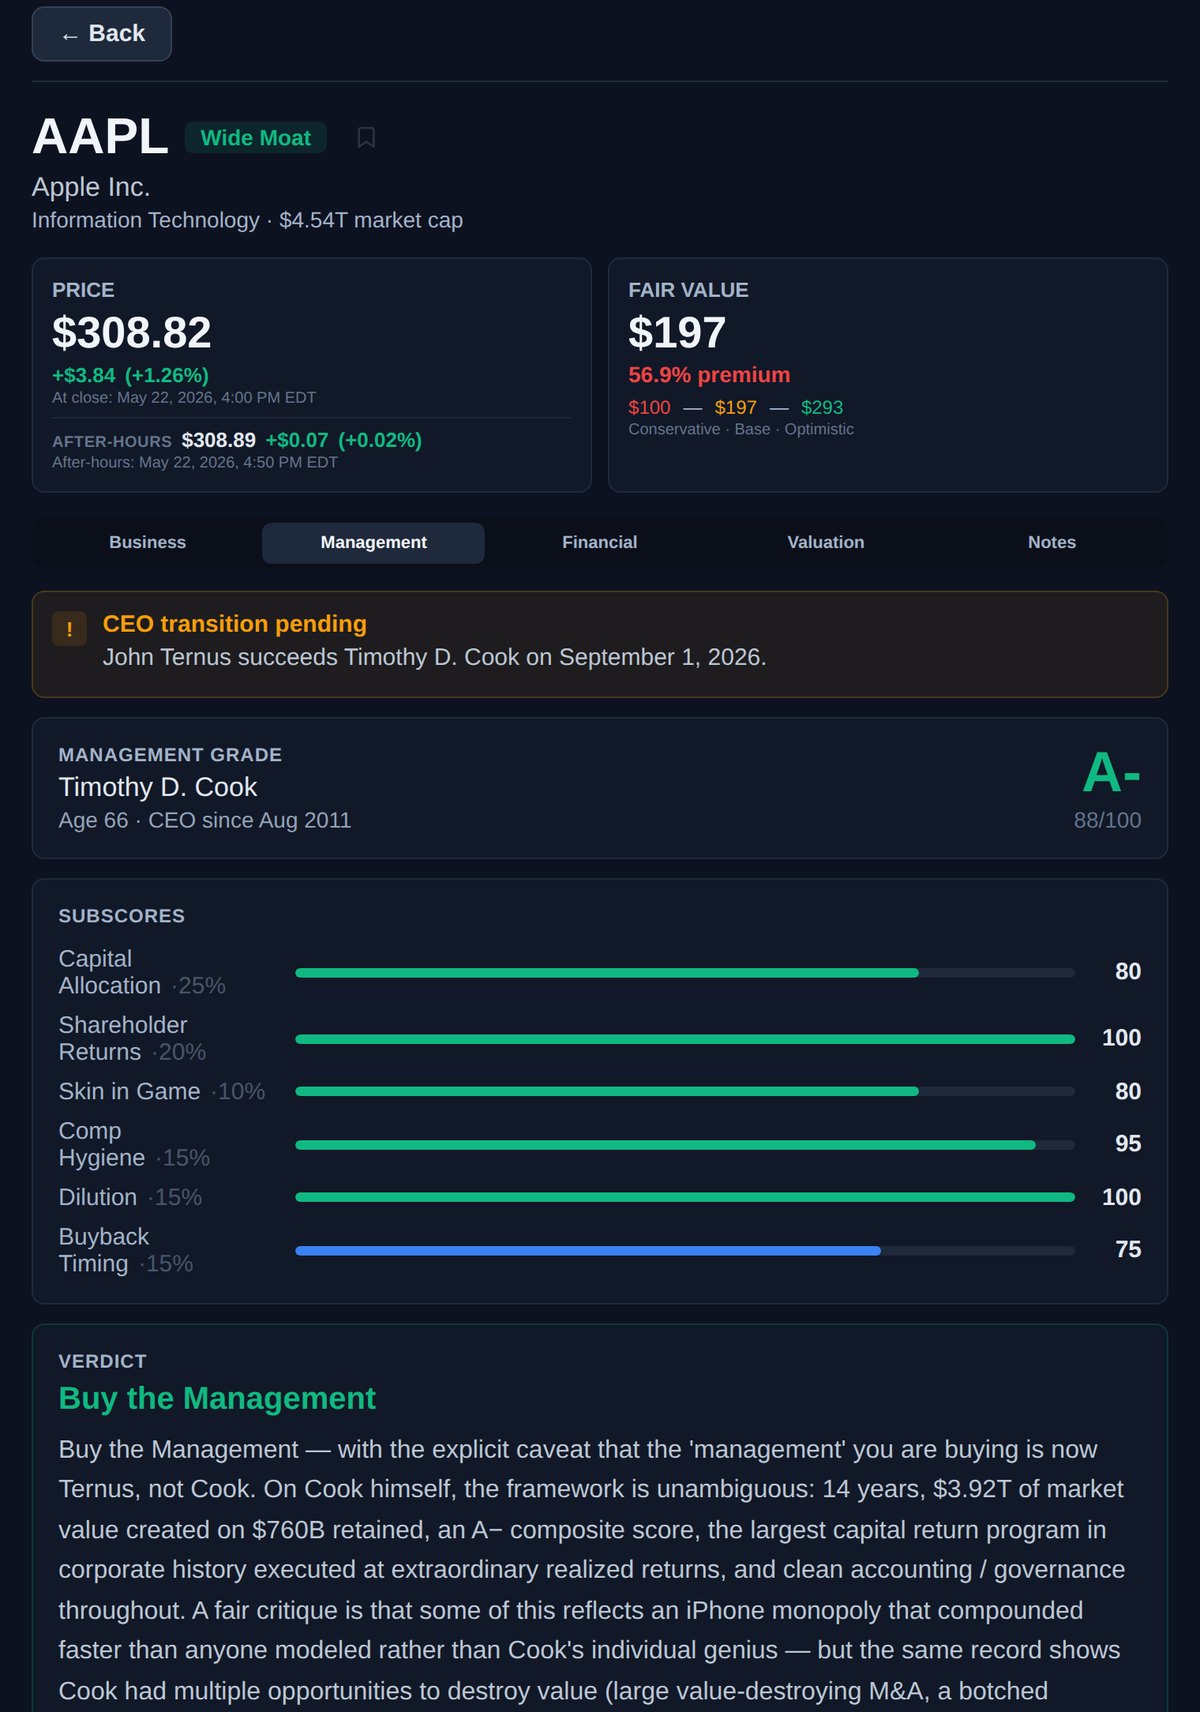
The grade is built from six weighted subscores, each measuring a different dimension of capital stewardship:
Every evaluation ends with a clear verdict:
📉 Price & Valuation Chart
The Valuation tab plots a stock's price history against MoatScope's fair value over time, so you can see at a glance whether today's price is unusual relative to the company's own history.
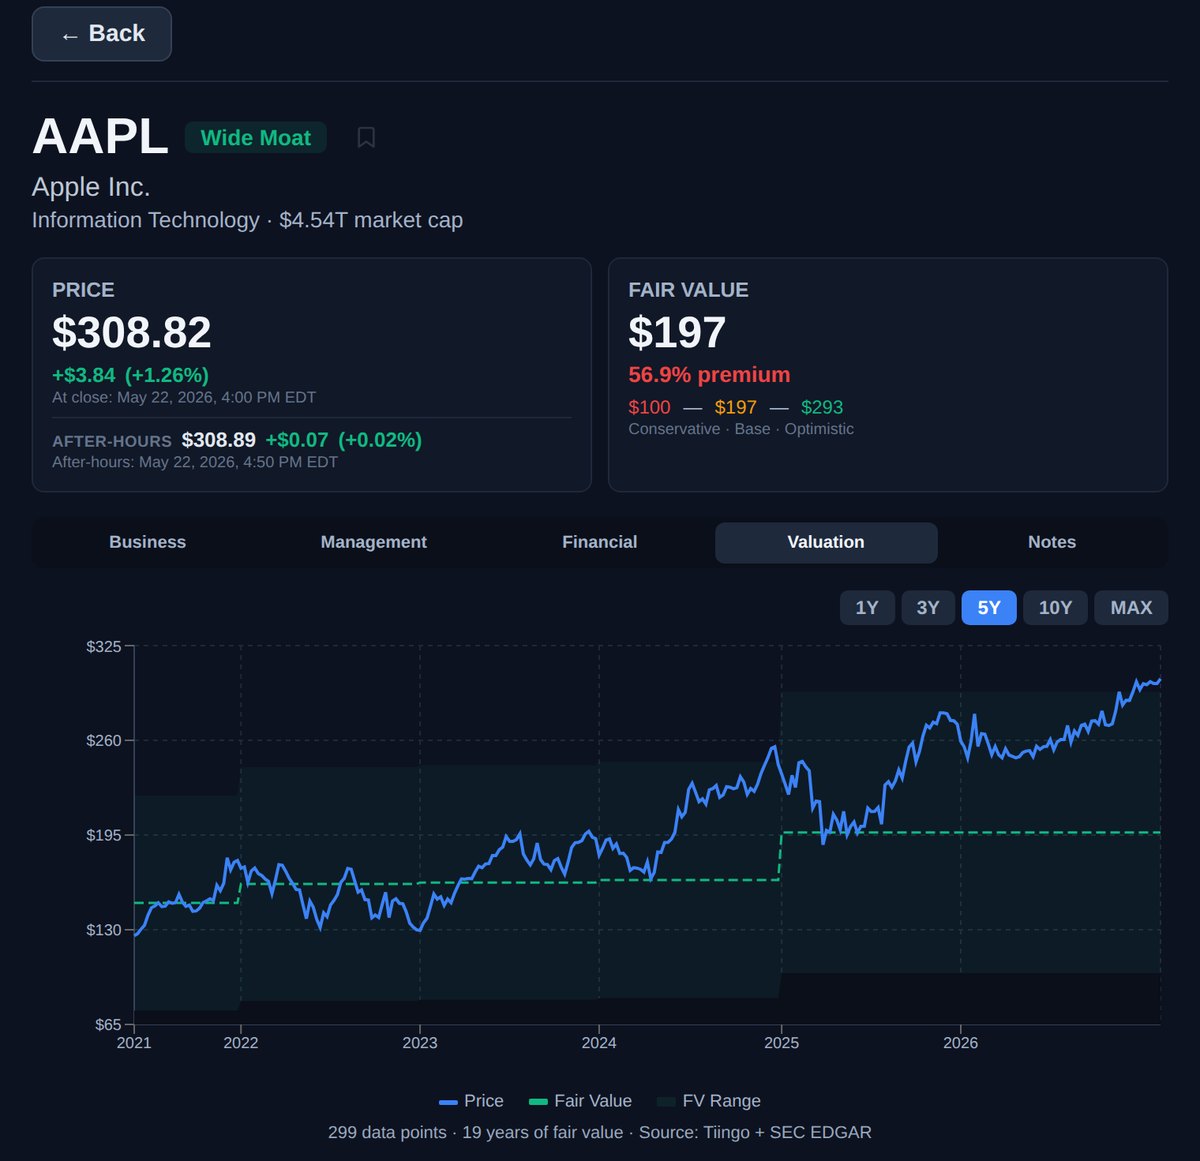
Price line — the stock's historical closing price.
Fair value line — MoatScope's Base estimate, recalculated each year from reported financials, so you can watch price and value diverge or converge.
Range band — the shaded area between the Conservative and Optimistic estimates.
Use the 1Y / 3Y / 5Y / 10Y / MAX selector to change the window. Price data comes from Tiingo; fair value is derived from SEC EDGAR filings.
🎛️ Filters & Screening
The left sidebar gives you powerful filtering to narrow down stocks:
Switch between "All Stocks" and your custom baskets (watchlists).
Filter by major index: DJIA (30 stocks), S&P 500, or NASDAQ 100. Counts show how many analyzed stocks are in each.
Toggle Wide, Narrow, and None to show only stocks with specific moat ratings. Great for focusing on wide-moat businesses.
Filter by competitive advantage type: Switching Costs, Network Effects, Intangible Assets, Cost Advantage, or Efficient Scale. Use "Any" to match stocks with at least one selected source, or "All" to require every selected source.
Filter by GICS sector: Technology, Health Care, Financials, Consumer Discretionary, Industrials, and more. Each shows a count of how many stocks in the current view belong to that sector.
Filter by management verdict: Buy the Management, Mixed, Avoid, or Insufficient Tenure. A fast way to surface businesses run by proven capital allocators — or to screen out the opposite.
Below the chart, range sliders narrow the visible Quality Score and P/FV ratio, and an X-max control lets you zoom the valuation axis in on stocks trading near fair value.
📈 Financial Statements
Inside the Financial tab, the Financials sub-view shows complete statements pulled directly from SEC EDGAR XBRL filings, with a highlighted TTM (trailing twelve months) column alongside up to nearly two decades of annual history.
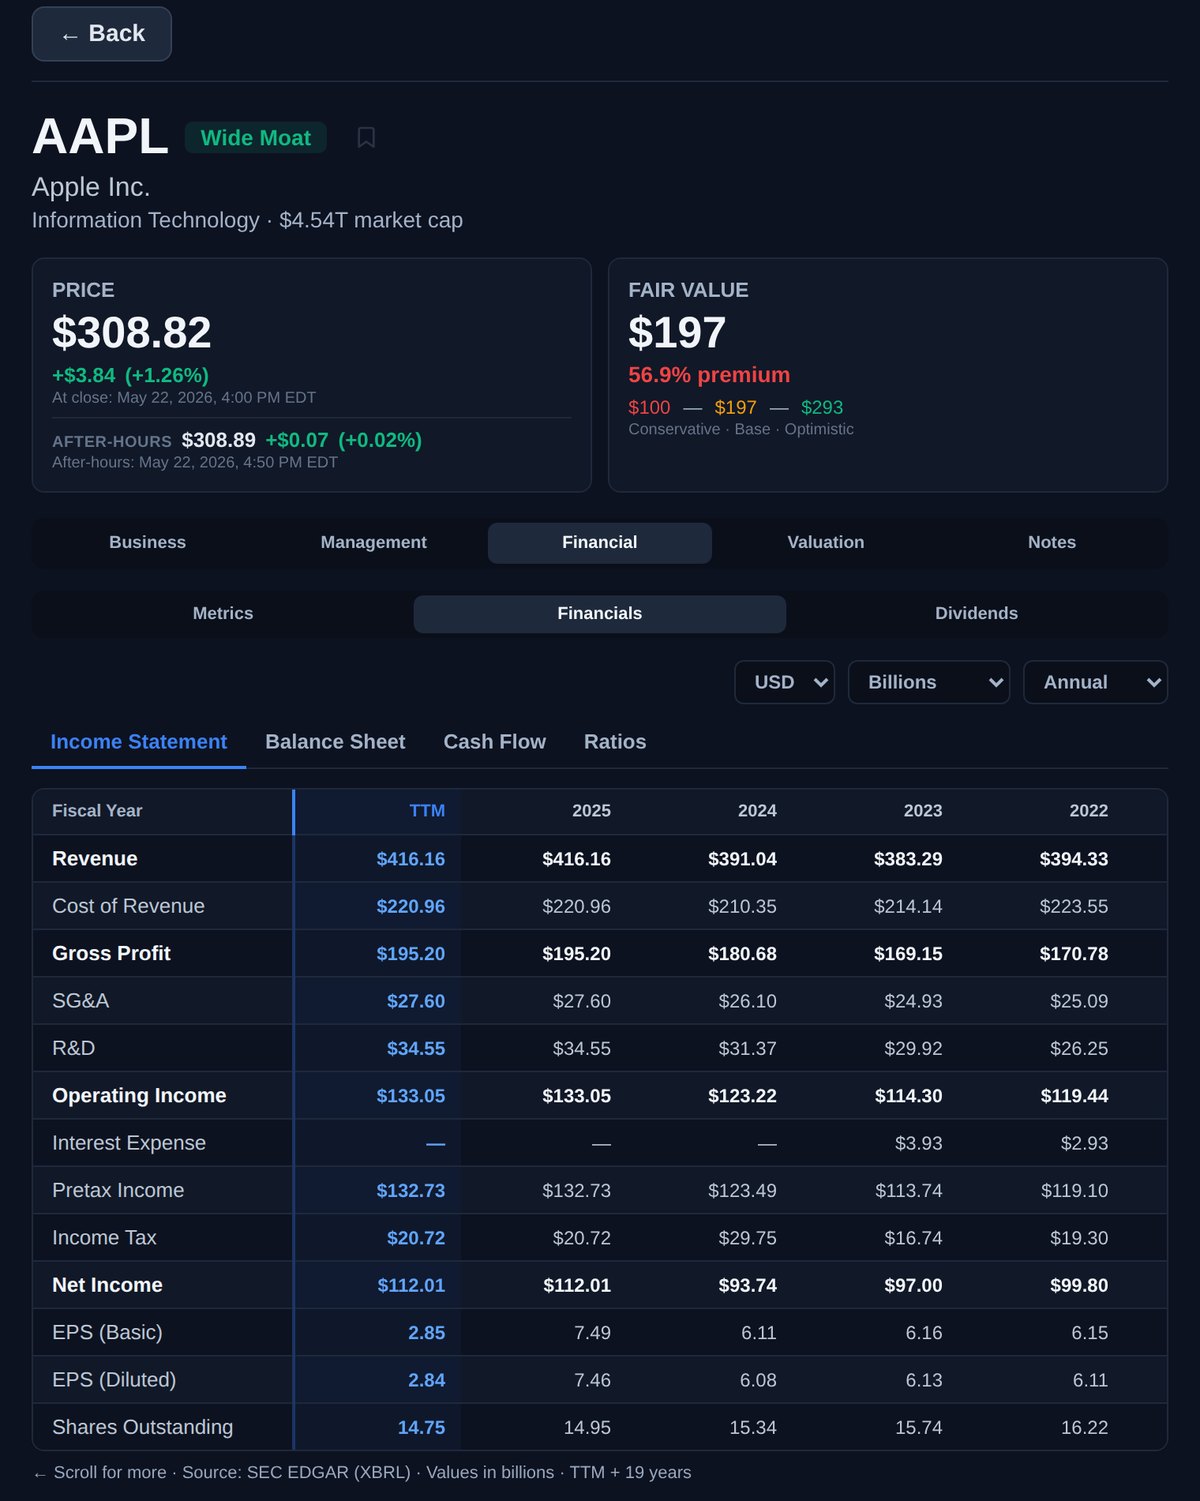
Income Statement — Revenue, cost of revenue, gross profit, operating income, net income, EPS.
Balance Sheet — Assets, liabilities, equity, cash, debt levels.
Cash Flow — Operating cash flow, capital expenditures, free cash flow, dividends.
Ratios — Key financial ratios computed from the statements.
Three dropdowns control the display: currency, scale (Billions, Millions, Thousands, or raw), and period (Annual or Quarterly). A third sub-view, Dividends, lays out per-year dividend history, payout ratio, growth, and the consecutive-raise streak for income investors.
🧺 Baskets & Notes
Baskets are custom watchlists that let you organize stocks into groups. Click the "Baskets" button in the top navigation to create and manage baskets.
Create a basket: Click "Baskets" → "New Basket" and give it a name (e.g., "Tech Leaders", "Dividend Growers").
Add stocks: When viewing a stock's detail panel, add it to any of your baskets.
Filter by basket: Select a basket in the sidebar to view only those stocks on the scatter plot and table.
Notes let you attach personal research notes to any stock. Use the Notes tab in the detail panel to jot down your thesis, key observations, or reminders. Notes are private and saved to your account.
💎 Plans & Pricing
MoatScope offers three tiers designed to give you the right level of access:
Scatter plot & filters
Basic moat ratings
Full blog & methodology
Fair value estimates
Full moat reasoning
Management evaluations
Custom baskets & notes
Screener CSV export
Early access to new features
Priority support
Ready to find great businesses?
Start screening stocks through the lens of competitive advantage.
Open MoatScope →